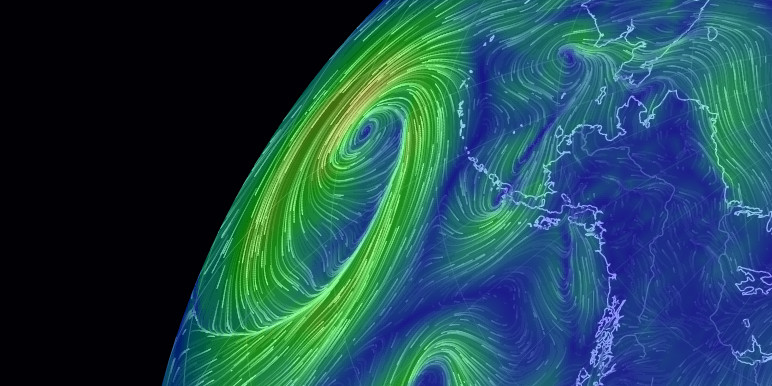
nullschool earth
a visualization of global weather conditions
forecast by supercomputers
updated every three hours
ocean surface current estimates
updated every day
ocean surface temperatures and
anomaly from daily average (1981-2011)
updated daily
ocean waves
updated every three hours
aurora
updated every thirty minutes
created by
Cameron Beccario -
@cambecc.nullschool.net
Nullschool Technologies Inc.
Community
- Newsletter
- news.nullschool.net
- EarthWindMap
- YouTube
- @nullschool-tech
- @nullschool
feedback
provide feedback about this site
inquiries
contact inquiries@nullschool.net for licensing or other questions
data sources
this product would not exist without the steady streams of Earth science data produced by scientists and engineers at government agencies and research labs across the globe
- Weather Data
-
GFS (Global Forecast System)
EMC / NCEP / NWS / NOAA - Ocean Currents Data
-
OSCAR v2.0
Earth & Space Research
Global Ocean Physics Analysis and Forecast
E.U. Copernicus Marine Service Information (CMEMS). Marine Data Store (MDS). DOI: 10.48670/moi-00016 - Sea Surface Temperature
-
OI SST (Optimum Interpolation Sea Surface Temperature) V2.1
NOAA Physical Sciences Laboratory, Boulder, Colorado, USA
note: OI SST data is preliminary if fresher than two weeks and may change
OSTIA (Operational Sea Surface Temperature and Sea Ice Analysis)
UK Met Office + GHRSST + E.U. Copernicus Marine Service Information (CMEMS)
RTGSST (Real Time Global Sea Surface Temperature)
MMAB / EMC / NCEP / NWS / NOAA - Ocean Waves
-
WAVEWATCH III
MMAB / EMC / NCEP / NWS / NOAA - Bleaching Alert Area
- Coral Reef Watch / NOAA
- Aerosols and Chemistry
-
GEOS-5 (Goddard Earth Observing System)
GMAO / NASA
CAMS (Copernicus Atmosphere Monitoring System)
Copernicus / European Commission + ECMWF - Aurora
-
OVATION
SWPC / NCEP / NWS / NOAA
Processing script written by Stephanie Deppe, PhD (profile) - Ultraviolet Index and Erythemal Dose Rate
- Climate Prediction Center / NCEP / NWS / NOAA
- Active Fires
-
Fire Information for Resource Management System (FIRMS) / EOSDIS / NASA
(see discussion below)
libraries & services
- Geographic Projection and Visualization Library
- D3
- Open Source Libraries
- see attribution and licenses
- Geographic Data
- Natural Earth
- GRIB/NetCDF Decoder
- NSF Unidata netcdf-java
- Hosting
-
Cloudflare
Amazon S3
Backblaze B2
Digital Ocean - Fonts
-
M+ FONTS
Google Noto Fonts - Icons
- Font Awesome Free by @fontawesome - CC BY 4.0
- Color Scales
-
ColorBrewer2.org
Kindlmann Linear Luminance
MYCARTA
Dave Green's cubehelix - Free Version of Source
- github.com/cambecc/earth
acknowledgements
- Inspiration
- HINT.FM wind map
- Prototype
- air.nullschool.net
about the data
the "Surface" layer represents conditions at ground or water level
this layer follows the contours of mountains, valleys, etc.
overlays show another dimension of data using color
some overlays are valid at a specific height
while others are valid for the entire thickness of the atmosphere
- Wind
- wind speed at specified height
- Temp
- temperature at specified height
- RH
- relative humidity at specified height
- WBT
-
wet bulb temperature at 2m above surface
calculated from GFS dry bulb temperature, dew point temperature, and pressure variables using the approach from Brice and Hall - Dew
- dew point temperature at 2m above surface
- WPD
-
Instantaneous Wind Power Density
measure of power available in the wind: ½ρv3, where ρ is air density and v is wind velocity - TPW
-
Total Precipitable Water
total amount of water in a column of air stretching from ground to space - TCW
-
Total Cloud Water
total amount of water in clouds in a column of air from ground to space - 3HPA
-
3-hour Precipitation Accumulation
amount of precipitation over the next three hours - CAPE
-
Convective Available Potential Energy from Surface
indicates the buoyancy of air, a measure of atmospheric instability and predictor of severe weather - MSLP
-
Mean Sea Level Pressure
air pressure reduced to sea level - MI
-
Misery Index
perceived air temperature as combination of heat index and wind chill - UVI
-
Ultraviolet Index
risk of harm from unprotected sun exposure due to the strength of sunburn-producing ultraviolet (UV) radiation
- 0 - 2
- low
- 3 - 5
- moderate
- 6 - 7
- high
- 8 - 10
- very high
- 11+
- extreme
- SST
-
Sea Surface Temperature
temperature of the ocean surface - SSTA
-
Sea Surface Temperature Anomaly
RTG-SST: difference in ocean temperature from daily average during years 1981-2011
OSTIA: calculated from 1981–present Pathfinder climatology
OI SST: calculated from 1971-2000 OI SST V2 climatology - HTSGW
-
Significant Wave Height
roughly equal to mean wave height as estimated by a "trained observer" - BAA
-
Bleaching Alert Area (7-day maximum)
the level of coral bleaching heat stress:- No Stress
- No heat stress or coral bleaching is present.
- Bleaching Watch
- Low-level heat stress is present.
- Bleaching Warning
- Risk of possible bleaching. Heat stress is accumulating.
- Alert Level 1
- Risk of reef-wide bleaching. Significant coral bleaching is likely.
- Alert Level 2
- Risk of reef-wide bleaching with mortality of heat-sensitive corals. Severe coral bleaching and significant coral death is likely.
- Alert Level 3
- Risk of multi-species mortality.
- Alert Level 4
- Risk of severe, multi-species mortality (> 50% of corals).
- Alert Level 5
- Risk of near complete mortality (> 80% of corals).
- COsc
-
Carbon Monoxide Surface Concentration
the fraction of carbon monoxide present in air at the earth's surface - CO2sc
-
Carbon Dioxide Surface Concentration
the fraction of carbon dioxide present in air at the earth's surface - SO2sm
-
Sulfur Dioxide Surface Mass
amount of sulfur dioxide in the air near the earth's surface - NO2
-
Nitrogen Dioxide
amount of nitrogen dioxide in the air near the earth's surface - DUex
-
Dust Extinction
the aerosol optical thickness (AOT) of light at 550 nm due to dust - SO4ex
-
Sulfate Extinction
the aerosol optical thickness (AOT) of light at 550 nm due to sulfate - PM1
-
Particulate Matter < 1 µm
mass of atmospheric particles with a diameter less than 1 micron - PM2.5
-
Particulate Matter < 2.5 µm
mass of atmospheric particles with a diameter less than 2.5 microns - PM10
-
Particulate Matter < 10 µm
mass of atmospheric particles with a diameter less than 10 microns - OMaot
-
Organic Matter aerosol optical thickness
The aerosol optical thickness (AOT) of light at 550 nm due to organic matter suspended in air.
This layer can be interpreted as the thickness of smoke from wildfires and other sources of combustion.
pressure levels
atmospheric pressure corresponds roughly to altitude
several pressure layers are meteorologically interesting
they show data assuming the earth is completely smooth
note: 1 hectopascal (hPa) = 1 millibar (mb)
- 1000 hPa
- 00,~100 m, near sea level conditions
- 850 hPa
- 0~1,500 m, planetary boundary, low
- 700 hPa
- 0~3,500 m, planetary boundary, high
- 500 hPa
- 0~5,000 m, vorticity
- 250 hPa
- ~10,500 m, jet stream
- 70 hPa
- ~17,500 m, stratosphere
- 10 hPa
- ~26,500 m, even more stratosphere
about ocean waves
Significant Wave Height is the average height of the highest 1/3 of waves at a particular point in the ocean. There's a great writeup here describing what this means.
Peak Wave Period is the (inverse) frequency of the most energetic waves passing through a particular point, whether wind generated or swells. Certainly, there are many more groups of waves moving through an area, each in different directions, but trying to show them all rapidly becomes complex. Instead, we show the one wave group contributing the most energy. This has the effect, though, of creating "boundaries" between regions of ocean where the #1 wave group suddenly switches to second place. Often these boundaries represent swell fronts, but other times they are just artifacts of the ranking mechanism.
about CO2 concentrations
for dates earlier than 2017-01-24 04:30 UTC
While implementing the visualization of CO2 surface concentration, I noticed the NASA GEOS-5 model reports a global mean concentration that differs significantly from widely reported numbers. For example, from the run at 2015-11-23 00:00 UTC, the global mean is only 368 ppmv whereas CO2 observatories report concentrations closer to 400 ppmv. GEOS-5 was constructed in the 2000s, so perhaps the model does not account for accumulation of atmospheric CO2 over time? This is simply speculation. I am just not certain.
To bring the GEOS-5 results closer to contemporary numbers, I have added a uniform offset of +32 ppmv, increasing the global mean to 400 ppmv. This is not scientifically valid, but it does allow the visualization to become illustrative of the discussion occurring today around atmospheric CO2. Without question, I would welcome a more rigorous approach or an explanation why the GEOS-5 model produces the data that it does.
From 2017-01-24 04:30 UTC, this adjustment is no longer necessary because GEOS-5 appears to have been upgraded.
about aerosols and extinction
An aerosol is air containing particles. Common particles are dust, smoke, soot, and water droplets (clouds). These particles affect sunlight primarily through absorption and scattering, which combine to reduce the amount of light reaching the ground. This loss of light as it passes through the atmosphere is called extinction.
One common measure of extinction is aerosol optical thickness (AOT), which is (the log of) the ratio between the power of incoming light and the power of transmitted light. This helps us understand how "thick" the air is with particulates.
about active fire data
Fire data is a combination of VIIRS 375m NRT (NOAA-20) and VIIRS 375m NRT (Suomi NPP) active fire products. Each fire detection data point contains the time of detection (when the satellite made the measurement) and the Fire Radiative Power (FRP) in units of megawatts (MW). For more information on how to interpret the readings, see the FIRMS FAQ and the detailed discussion of VIIRS I-Band 375 m Active Fire Data.
We acknowledge the use of data and/or imagery from NASA's Fire Information for Resource Management System (FIRMS), part of NASA's Earth Observing System Data and Information System (EOSDIS).
keyboard shortcuts
- e
- show the menu
- escape
- close dialog/menu
- n
- go to now (the most recent data)
- shift-c
- show the date selection calendar
- j
- go backward one time step
- shift-j
- go backward several time steps
- k
- go forward one time step
- shift-k
- go forward several time steps
- g
- toggle the grid on/off
- p
- toggle the animation on/off
- shift-h
- enable/disable high definition mode
- shift-t
- show settings
- i
- go up one pressure level
- shift-i
- go up to the stratosphere
- m
- go down one pressure level
- shift-m
- go down to the surface
- d
- zoom in
- shift-d
- zoom in faster
- x
- zoom out
- shift-x
- zoom out faster
- w
- rotate up
- shift-w
- rotate up faster
- z
- rotate down
- shift-z
- rotate down faster
- a
- rotate left
- shift-a
- rotate left faster
- s
- rotate right
- shift-s
- rotate right faster
translators
Александр Попов Вячеслав Епиков 1599763839 1992pb 2451158917 피시 afropolakwot agagey Aleksander Alexander Kirilov Alexey Dmitriev Alexey Korsakov AlexOrlovets Anderson Porto Andre Lz Andrea de Franco Andrew Pedrini Andrey Bagmanov Antonpek arquerogonza Artur Wisniewski ashawesoman ashvin.j.sherathiya astrostrong asveruz atom Belore Stergann bgij bidulem3 Birg3r Bohuslav Šín Bram Versteeve Bryan carina.bringedal carlofrc Cassiel Bclamson Ching-ping Yu Christian Leroux contact cuxcoll Daniel Bartsch Daniel Isak Marinosson Daniel Pawlowski Daniel Rakoczy danielruiz1636 Darlite davalenciano98 Davide Carlier Denat250 deus.05 Dimitris T. Papadimitriou dlo.daniel Dominic Douglas dsantosgtm dustyhofman e Eason Huang egarpunov elier.pila Eric Kim essaii32 estefilippini fantasy_lcl farrasoctara Felipe Faria florian-lerch franci00 FranklinZhang Frederik T. de Ridder fthmiln georg.loesel gherlainfo giacomo.gerosa Gian Centeno giospud gonzalo.ag88 gporter.seadog graceang graham.rimmington grol2901 Hebel holgersson Hyung Wook Jung Ichiro Wang Ignacio Sanz iii1212 InfoSecOne Jae Soo Park Jiří Batelka Joanna Rinne Joao Correia jocelot Jomari Joseph Barrera Jonathan Yang Jose A. Frias Morales juanpaexpedite kai.s.mueller Karol Sapiński Kiyun Jeon kjetil.hoiby kty5663 ku5an2901 laurapaccini leandro1212 leticia.tahnee lretamal Luboš Motl marcello.carreira marco.prosdocimo Mark markeletona Markus Schley Martine Bolzinger Matt Tang Mattia Raffa mavilesilva melfi Melissa Ortiz Massó Meow Wang mgb Michael Purer Michael Michel Rivero mikami_1966.1118 mikele.fit95 Miquel Bayo Moreno mir597 MirageF1AZ Miroslaw Lisiak Mohannad Alahmadi m_strugale nando nunolava1998 Olivier OLS-RU Oğuzhan Arı Paul Bachem Paweł Kowalczyk pdobrev Personim Intaned Philippe Jabet Plamen Dobrev ProffLex P_A_N_D_A_M_A_N Rafael Nonato Bassora rajeshgodvani RaskiPL reyfran8 Riccardo Monfardini robertrosalex Roger Helman Roller978 rosariainpo Russel Schwartz santiago.giraldoc sapan021 sarogrom Seongmin Park september43 Seregalsv Serega silverhaze030 Simone Dragoni siudzin98 skyneon77 sombrasbaul Somil Thesia Stephen Flynn Steven SUGIMOTO Tatsuo Sunny Miu Tayseer M Alhibshi Telmo John tenderstart thanhhuyenlth Thomas Middelveld Thorsten Schleicher tigormal tigra200sx Tomasz Waligóra torstenleibrich tsuka tama ulaszewski.bartosz ultordima Vasily Tarasenko vhc1967 Vu Thuong Víctor Velarde wasted webfreelance Wonmin Jeong wtlovergirl xesmedic xorpid xrdeem xsqz 潘柏綸 yaawwad Yauhen Bahashou youngjune4498 Youngmin Jeon Yukun Chen zackcaussy Zulus Οverlord
citations
Selected for inclusion in the Climate Literacy and Energy Awareness Network (CLEAN) collection of educational resources.
disclaimer
The GEOS-5 data used on this site have been provided by the Global Modeling and Assimilation Office (GMAO) at NASA Goddard Space Flight Center through the online data portal in the NASA Center for Climate Simulation
GEOS-5 data (covering all Chem and Particulates layers) comes with the following disclaimer: Forecasts using the GEOS system are experimental and are produced for research purposes only. Use of these forecasts for purposes other than research is not recommended.
Generated using Copernicus Atmosphere Monitoring Service Information 2017-2020. Neither the European Commission nor ECMWF is responsible for any use that may be made of this information.
weather and ocean data are generated from numerical models
Nullschool Technologies Inc. implies no guarantee of accuracy
Copyright (c) 2026 Nullschool Technologies Inc.